By Sarah Hansen
Underwater plants like sea grasses provide habitat and feeding areas for a wide range of aquatic life. They also help filter the water and put the brakes on erosion. But in Chesapeake Bay, the coverage of underwater plants, or submerged aquatic vegetation (SAV), has been low for decades, and restoration attempts have had mixed results. That’s why this summer, Smithsonian Environmental Research Center intern Bridget Smith is grappling with 28 years of data to explore which of a host of factors affects SAV in the Bay and how.
The type of shoreline can have an enormous impact –whether it’s man-made piled rocks (“riprap”) or vertical wood paneling (“bulkhead”), or undisturbed marsh, beach, or forest. Depth, salinity, water quality, and distance from shore may also play a role. Shoreline fragmentation, different types of shoreline along small sections of the coast, could be important as well.

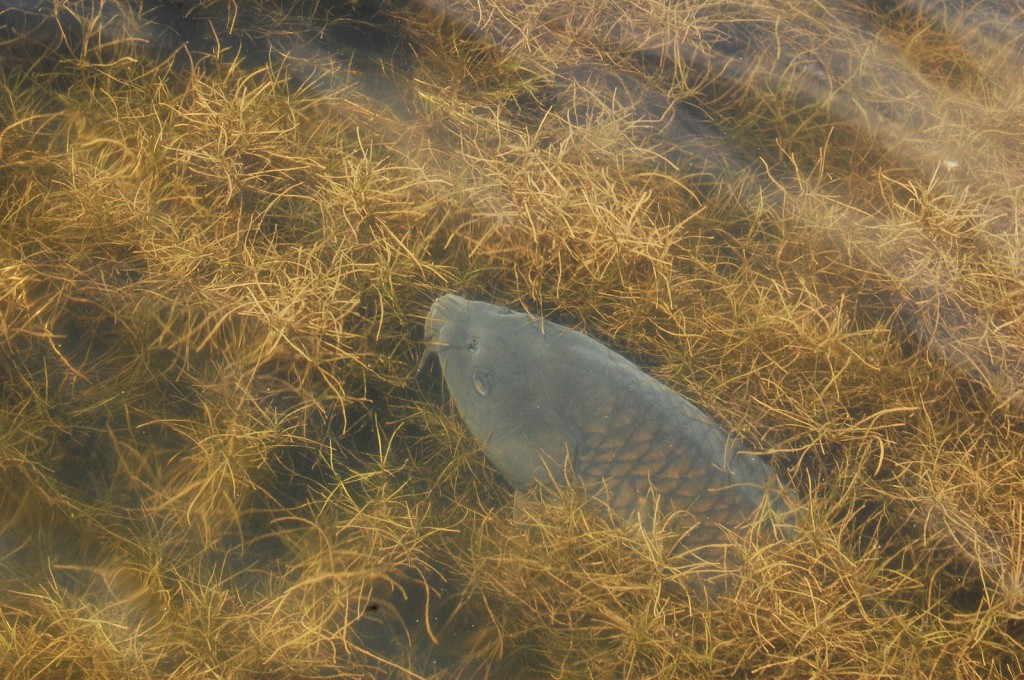
A carp enjoys bay grasses, a type of SAV, in Chesapeake Bay’s Poplar Harbor. (Photo used under CC BY-NC 2.0 License)
How can Smith possibly tease out how all these factors come into play? Boatloads of data collected over almost three decades, a geographic information system (GIS), and some computer programming skills hold the keys. A GIS is a computer program for organizing and analyzing many types of mapped information, including remotely sensed data (such as satellite imagery), GPS information and data collected by aircraft.
“You can do pretty much anything with GIS,” Smith said, “but that doesn’t mean it’s appropriate or scientific.” With so much data at her disposal, Smith spent the first part of the summer just selecting and assembling the data that she’ll use in her analysis—no trivial task. Choosing a representative data set is critical to generating valid results.
Smith will plumb the data to reveal complex interactions between depth and distance from shore and also discover what else is influencing SAV. It’s impossible to isolate these factors in nature, but the GIS combined with statistical analysis can clarify what’s causing what. Clambering through the data jungle to untangle which factors impact SAV is what drives Smith. “Things aren’t quite clear yet,” she said, “but it looks really promising and exciting, so I’m really happy about that.”

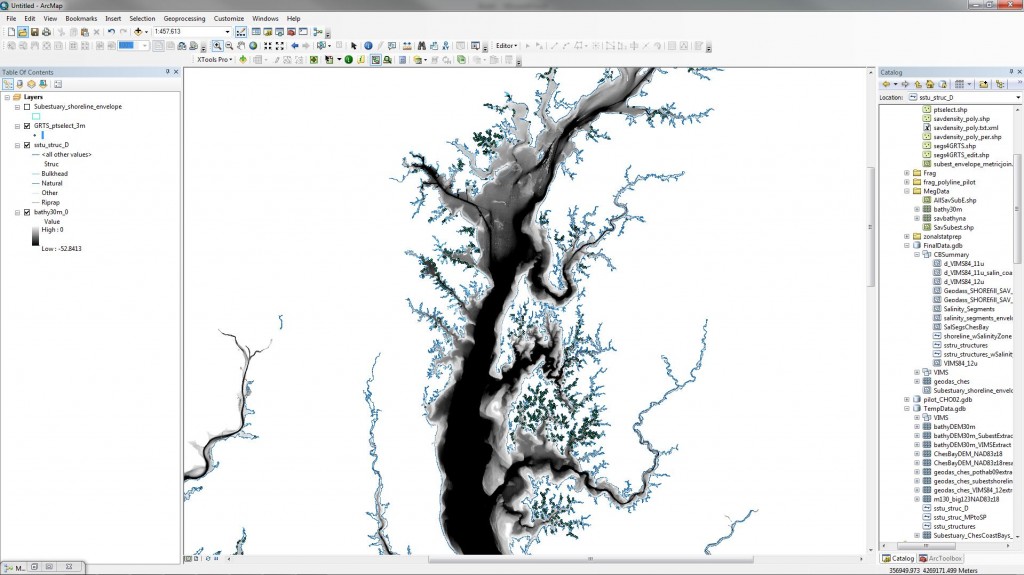
A map Smith used in her analyses. It shows selected points (tiny black dots) that she’ll use to answer a question about maximum depth of SAV in the Bay. (Bridget Smith)
As the links become clearer, the results could aid underwater plant conservation. Managers can focus limited resources on areas where SAV is most likely to thrive if the shoreline is restored. Smith’s work will also help identify human practices that are the most damaging to SAV so those practices can be discouraged.
Smith is an Environmental Sciences major at the University of California, Berkeley, and fell into GIS work largely by chance. But now she’s hooked. When she gets back to the SERC dorm each evening, “I realize that the best part of my day was solving problems in the lab.” Because of her burgeoning interest, she’s pursuing a minor in Geospatial Information Science and Technology.
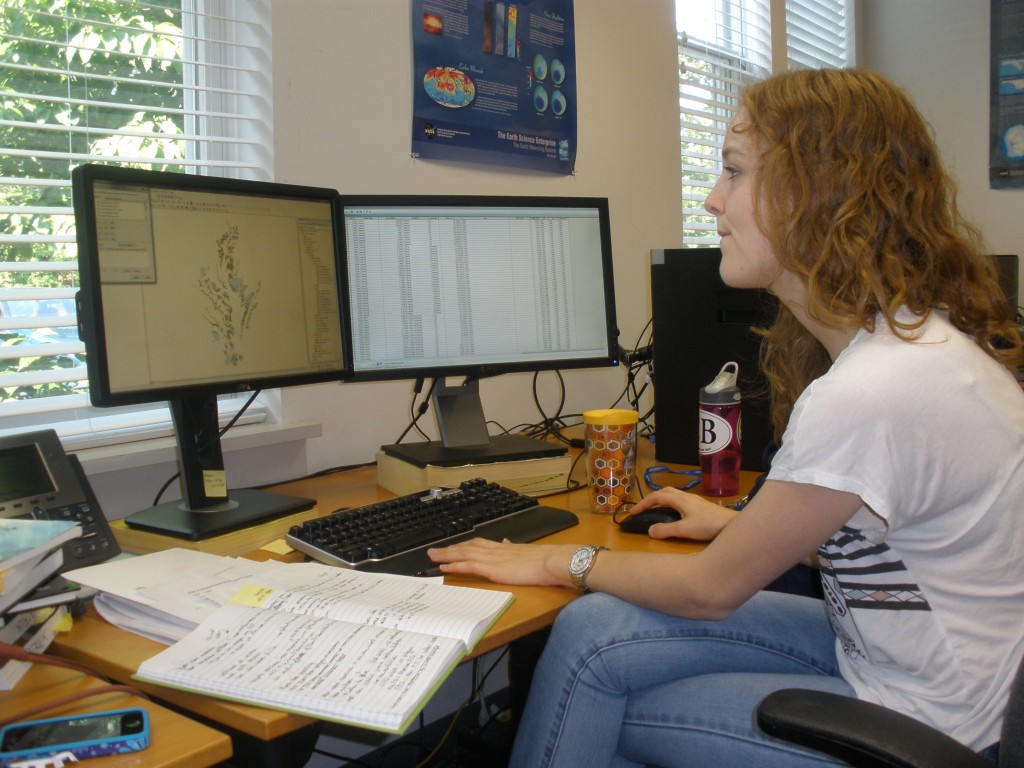
When asked if she plans to continue with GIS work after graduation, Smith doesn’t hesitate. “Oh yeah,” she said. Using computer programs to analyze thousands of data points isn’t for everyone, but today it’s an important part of the scientific process. Smith has found her niche. Surveying her two large monitor screens, sprawling with maps, graphs, and spreadsheets, she reflected: “It’s been amazing to see how you can go form an idea to all of this.”


